 ReelShort · real screenshot
Intensity is not audience scale
The February update raised the global model to $14 billion and made the U.S. ex-China concentration explicit; its engagement comparison needs equally careful reading.
The business behind the short-form boom
Follow the companies, capital and viewing habits reshaping vertical drama. Real platforms. Traceable numbers. A closer read.
11 source-led records · Local review edition
ReelShort Inspect this screen ↗ DramaBox Inspect this screen ↗
 Vigloo Inspect this screen ↗
What was announced. What remains unknown.
Keep the metric and its denominator together.
Open the screen behind the story.
The longer view
company record / Source dated 9 October 2025
The disclosed number was more than 200 planned titles over two years; the undisclosed number was the size of Fox's equity stake.
Backfilled, with the dates intact
ReelShort · real screenshotThe February update raised the global model to $14 billion and made the U.S. ex-China concentration explicit; its engagement comparison needs equally careful reading.
 Holywater Tech · real screenshot
The January 2026 financing attached capital to vertical series, digital books, AI streaming and ad-supported distribution; company growth claims require separate treatment.
DramaBox · real screenshotThe useful information in Omdia's 2025 forecast is its broader geography and monetization framing — and the reason it should not be merged with Sensor Tower IAP data.
No reconstructed interfaces
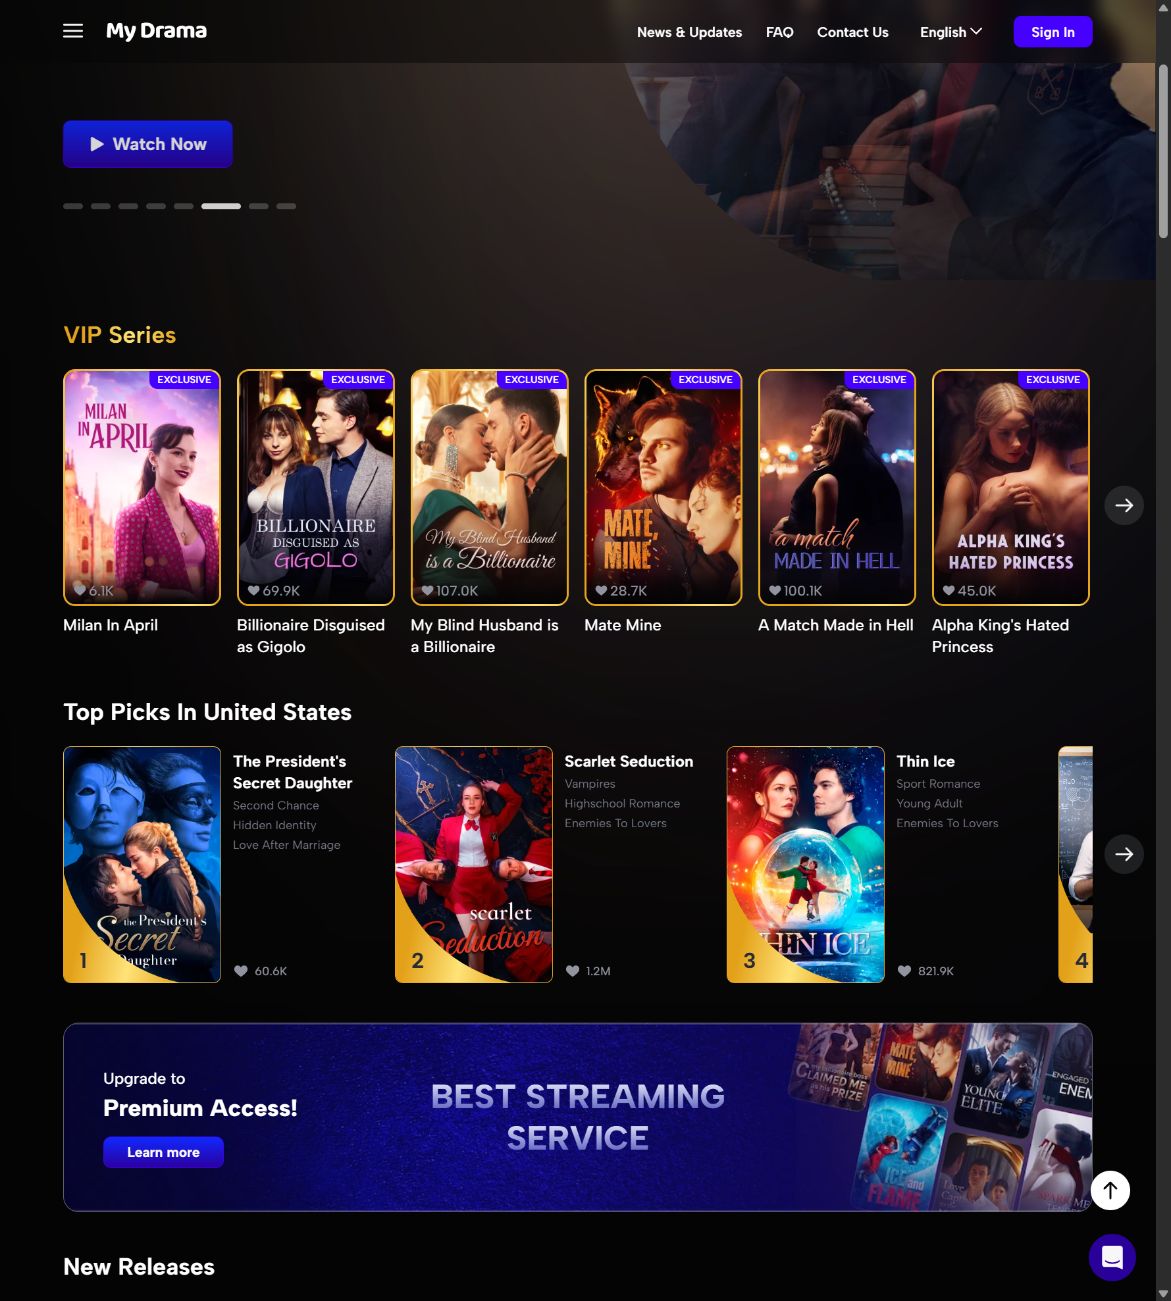
Actual public-platform captures from 16 September 2026. Current screens illustrate the products, not historical audience or revenue.
The market lens / Read the denominator
Change the lens to see what each number measures—and what it leaves out.
Sensor Tower / App Store + Google Play
~$700MA channel-specific estimate. Advertising, direct web payments and third-party Android stores are outside this measure.
Read the measurement note →Quarterly IAP revenue · USD millions
Nearly four times the year-earlier estimate. These are not total industry revenues.
Sensor Tower · July 2025 ↗Omdia / Global microdrama revenue
$14BA broader analyst market model, including China. It is neither audited revenue nor an extension of the app-IAP chart.
Read the scope and geography →Annual global revenue · USD billions
As described in Omdia's February 2026 release. The forecast is not a completed-year result.
Omdia · 23 February 2026 ↗U.S. mobile / Q4 2025 usage
35.7minA measure of viewing intensity, not total audience. It does not include television viewing or imply greater overall reach.
Why the denominator matters →Daily minutes per mobile user
Omdia analysis of Sensor Tower mobile data; selected U.S. services, Q4 2025.
Open the underlying comparison ↗The catalogue / Actual title art
A closer look at the creative work behind the market.
 View artwork +
Portrait title artwork from the original catalogue. A reference for how status, romance and identity are packaged in a single frame.
Original source ↗ReelShort / respective rights holders View artwork +
Official title artwork preserved from the existing field-guide collection. Genre and tone can vary far beyond one familiar romance template.
Original source ↗Vigloo / respective rights holders View artwork +
Source artwork retained for regional context. This landscape image is displayed uncropped in the inspector; it is not an app screenshot.
Original source ↗Image supplied to China Daily / respective rights holdersNewly revised / 19 September 2026
 Sensor Tower · source artwork
Revised backfill · source checked
Sensor Tower's June 2026 report measures a rapidly expanding app category. Installs, purchases and people still need separate columns.
 Google · source artwork
Revised backfill · source checked
Google's May 2025 announcement established a native-audio capability. It did not establish the cost of a finished vertical-drama episode.
 Omdia / Sensor Tower data · source artwork
Revised backfill · source checked
A companion to our Omdia market record: why minutes per user and audience size cannot stand in for one another.
The rule of the ledger
App-store purchases, modeled industry revenue and daily mobile minutes answer different questions. Each record separates reported facts, our interpretation and the limits of the evidence.
How to read this edition →Keep reading the original field guide →